T.i.P.S.
-
 Students should use their knowledge of collecting, sorting, and organizing data using tally marks and charts to now applying the same processes to a picture graph or a bar-type graph. Students must also be able to draw conclusions, ask questions, and interpret the information from the picture graph or bay-type graph to solve problems.
Example
-
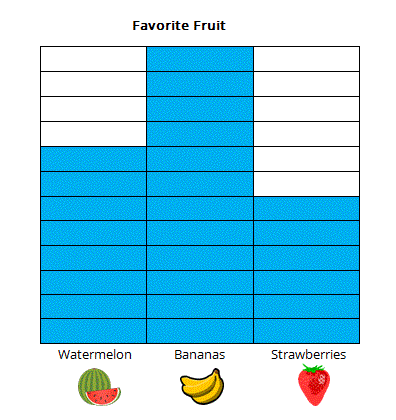
Each student in the class was asked, “What fruit do you like best?” The results of the survey are shown on the graph. Use the graph to answer the questions. Write a number sentence to that helps you solve each problem.
 a) How many more students liked bananas than strawberries?
b) How many students answered the question?
c) If 8 more students pick strawberries, how many votes for strawberries will there be?
d) Write and answer one more question using the data that was collected.
Digital Tools
-
Click on the following links for interactive games.
Resources
-
Click on the following links for more information.
TEKS
-
1.8 Data analysis. The student applies mathematical process standards to organize data to make it useful for interpreting information and solving problems. The student is expected to:
(C) draw conclusions and generate and answer questions using information from picture and bar-type graphs


 Click
Click 

